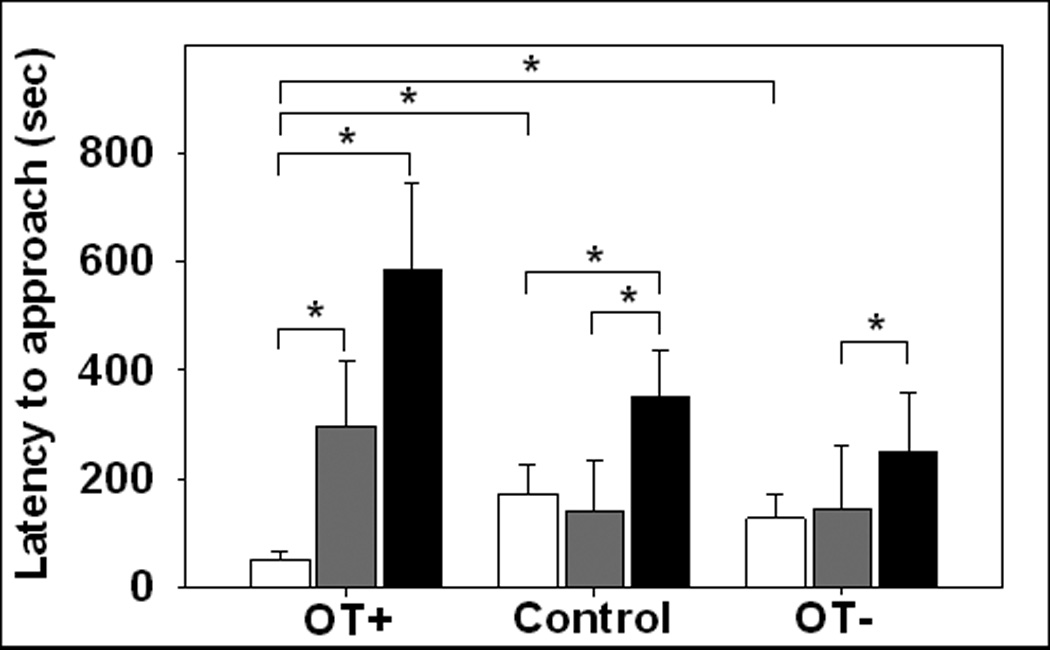
Fig. 3.

The latency to first approach each social stimuli during the 3-week preference test controlling for OT manipulation (OT treatment (OT+), control treatment (Control), and OT antagonist treatment (OT−)). White bar indicates interactions with the partner, grey bars indicate interactions with the opposite-sex stranger, and black bars indicate behavior while alone near the neutral, empty cage.
