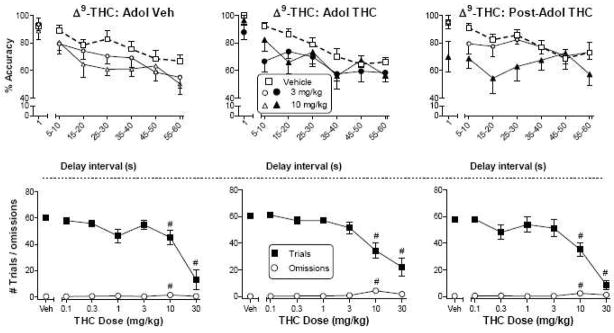
Figure 1.
Effects of Δ9-THC on accuracy (top panels) as a function of delay interval in a DNMP procedure in rats treated with vehicle (left panels) or Δ9-THC during adolescence (PN21-50, middle panels) or with Δ9-THC after adolescence (PN50-79, right panels). For each treatment group, numbers of trials and omissions are shown as a function of Δ9-THC dose (bottom panels). Values represent the mean (±SEM) accuracy or number of trials or omissions. For all doses, n=10–11 rats. In the top panels, the vehicle condition is shown by bold dashed line. Significant dose effects compared to vehicle are indicated by filled symbols. In bottom panels, # indicates a significant main effect of dose for trial number and/or omissions (p<0.05 compared to corresponding vehicle).

