
Figure 2. RSK2 phosphorylates NFAT3 at multiple serine sites.
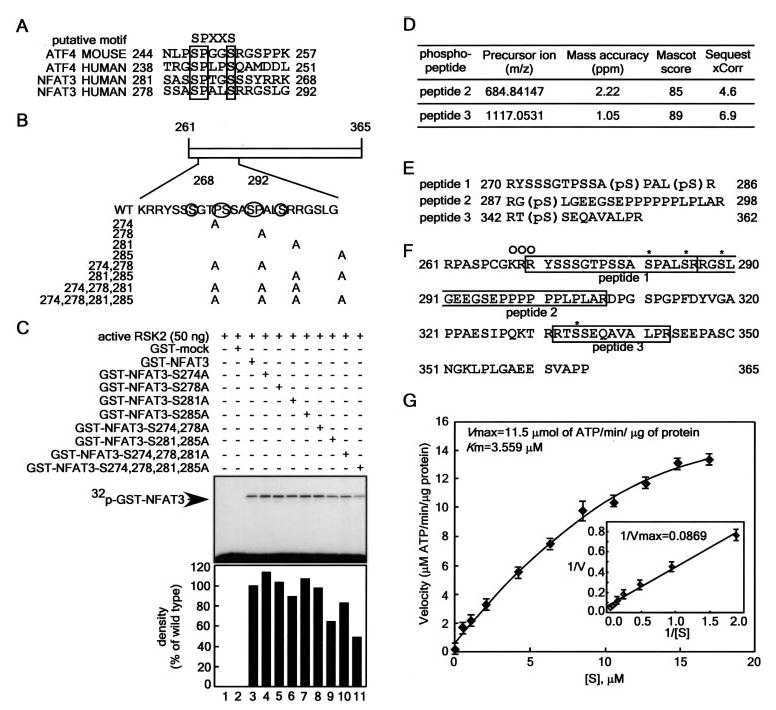
A, amino acid similarity of activating transcription factor-4 (ATF4) and NFAT3. B, schematic diagram of the construction of GST-NFAT3-(261–365) point mutants. C, effect of point mutation of GST-NFAT3 on its phosphorylation by RSK2. Active RSK2 was combined with each GST-NFAT3 mutant protein and 50 μm unlabeled ATP plus 10 μCi of [γ-32P]ATP. Reactions were conducted as described under “Experimental Procedures.” The band intensity of each mutant was compared with that of active wtRSK2/GST-NFAT3-(261–365) (100%) using the Scion Image Version Beta 4.0.3 computer program and quantified as shown in the lower panel. D, identification of phosphorylated peptides. The GST-NFAT3-(261–365) phosphorylation sites were determined using an LTQ Orbitrap hybrid mass spectrometer. The ions generated in the collision-induced dissociation tandem mass spectrometry ion trap scan were used to identify potential phosphopeptides by looking for the characteristic neutral losses of H3PO4 and H3PO4 + H2O from precursor ions during collision-induced dissociation fragmentation. In each case, the tandem mass spectrometry fragmentation was adequate enough to identify the phosphopeptide. The phosphopeptides were scored from both a Mascot and Sequest search of all species in the Swiss Protein Database (March 3, 2006), allowing only full tryptic peptides, with the variable modification allowing for phosphorylation of serine, threonine, and tyrosine. The precursor ion masses were taken from the Orbitrap Fourier transform full scan. E, target amino acid sequences of NFAT3-(261–365) containing phosphorylation site(s). F, amino acid alignment of NFAT3-(261–365). The peptides identified are boxed, and the vertical line indicates a trypsin digestion site. Asterisks indicate sites phosphorylated by RSK2, and open circles indicate the NLS. G, enzyme kinetics of RSK2 phosphorylation of NFAT3-(261–365). To analyze the kinetics of RSK2 phosphorylation of NFAT3, 5 ng of active RSK2 were reacted for 20 min with the indicated concentrations of purified NFAT3-(261–365) in 25 μl of reaction mixture containing 10 μCi of [γ-32P]ATP. Enzyme activity is represented by Lineweaver-Burk plots. Data points are represented as the means ± S.D. of three determinations obtained in one experiment.