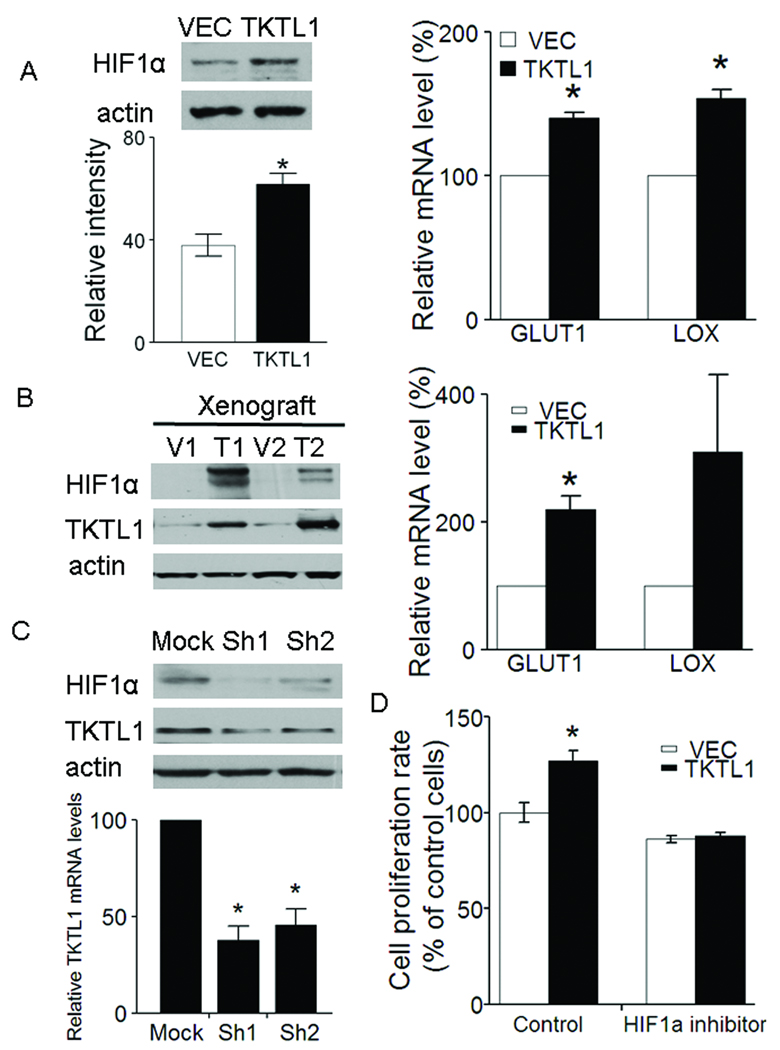
Figure 5. TKTL1 contributes to HIF1α accumulation in HNSCC.
A, left, the protein levels of HIF1α were determined 4 h following switching from culture medium to Krebs-Henseleit buffer in O11 cells stably expressing TKTL1. HIF1α was overexpressed by 1.5-fold in the O11 cells stably expressing TKTL1 versus its corresponding vehicle cells (n = 3, P < 0.05). Right, quantitative RTPCR analysis for two HIF-regulated downstream genes, GLUT1 and LOX in O11 cells expressing TKTL1. Shown are mean values of triplicate assays ± SEM. *P<0.05. B, left, the protein levels of HIF1α and TKTL1 in tumor xenografts originated from TKTL1-expressing O11 cells compared with those from vector-expressing cells. Representative images from three independent experiments were shown. Right, quantitative RTPCR analysis for GLUT1 and LOX in tumor xenografts originated from TKTL1-expressing O11 cells. Shown are mean values of triplicate assays ± SEM. *P<0.05. C, Western blot analysis on HIF1α and TKTL1 in from FaDu cells after transient transfection of TKTL1 shRNAs. After 48 h of transfection, cells were incubated with glucose-free Krebs buffer for 4 h. The cells then were harvested for Western blotting. Results are representative of three independent experiments. Bar graph shows the inhibition of TKTL1 expression in Fadu cells after TKTL1 shRNA transfection, as quantitated by quantitative real-time RTPCR. *P<0.05. D, the growth of O11 cells stably expressing TKTL1, was inhibited after treatment with NSC134754, a HIF1α small inhibitor. Cell growth was estimated by using MTT assay, after exposure for 48 h to 0.5 µM of NSC134754. Data are mean ± SEM. values from three independent experiments. *P<0.05.

