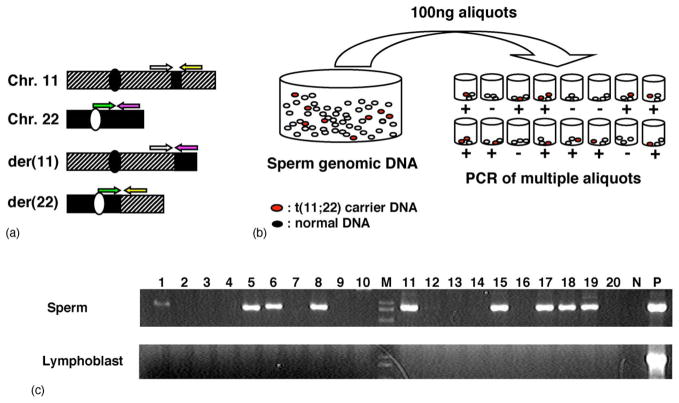
Fig. 3.
High frequency of de novo t(11;22) in sperm from normal males. (a) Translocation-specific PCR. Hatched boxes indicate chromosome 11, whereas dotted boxes depict chromosome 22. Centromeres are depicted as circles, while the PATRRs are indicated as filled boxes. The four PCR primers used for translocation-specific PCR (arrows) can be distinguished by the different colors. (b) Strategy for estimation of translocation frequency by PCR. Genomic DNA was extracted from sperm samples. Translocation-specific PCR was performed using multiple batches of template DNA. The translocation frequency was calculated using the equation, q = 1 − (1 − p)1/n; n = number of haploid genomes per aliquot, p = the probability that an aliquot contains a translocation product, and q = the probability that one randomly selected haploid genome in a given aliquot sustained a translocation. (c) The results of PCR. Upper panel shows the results from sperm DNA, whereas the lower panel indicates those from lymphoblast DNA. Lane M, size marker; lane N, negative control; lane P, genomic DNA from a t(11;22) carrier serving as a positive control.

