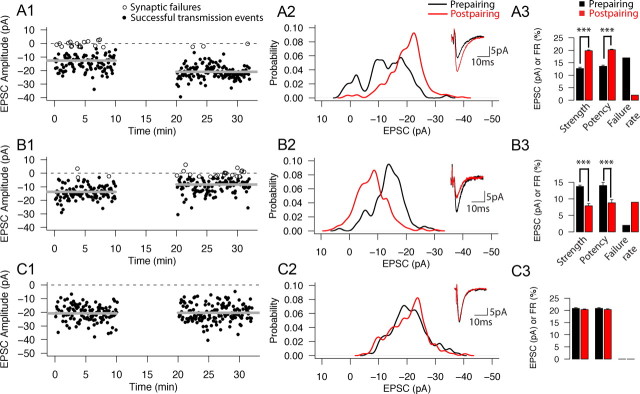
Figure 2.
Recordings from three example L4–L4 cell pairs demonstrating that responses to pairing are heterogeneous. Examples of connections that underwent LTP (A1–A3), LTD (B1–B3), or NC (C1–C3) in response to the pairing. A1–C1, Time plots for each of the three example cell pairs. Horizontal gray lines indicate the average uEPSC peak amplitude before and after pairing. Horizontal dotted line indicates the 0 pA level. Synaptic failures are shown as open circles, and successful synaptic transmission events are shown as filled circles. Pairing epoch is shown as a 10 min gap. A2–C2, PDFs for the prepairing (black trace) and postpairing (red trace) conditions. Insets show the average of all recorded traces before (black) and after (red) pairing. A3–C3, Bar plots showing the strength, potency, and failure rate values for the prepairing (black bars) and postpairing (red bars) conditions. Failure rates are single scalar values so no error bars or statistical comparisons are shown; for strength and potency, error bars indicate SEM. ***p < 0.001, significant changes after pairing (Wilcoxon's test).

