
Figure 3.
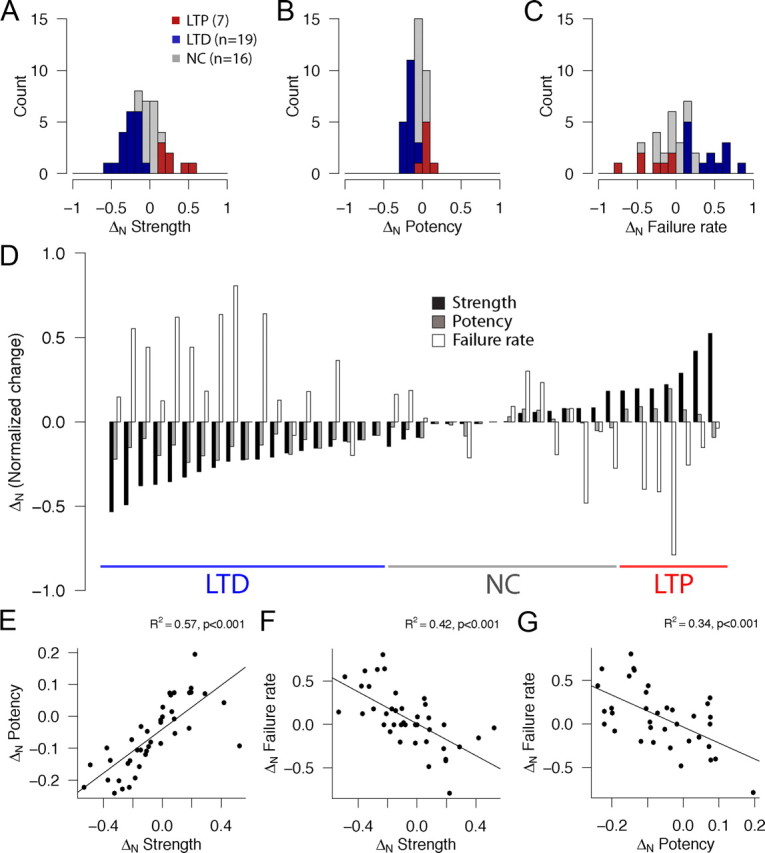
Pairing-induced changes in synaptic strength, potency, and failure rate. A–C, Histograms showing the distribution of normalized (ΔN = Xpost− Xpre/Xpost + Xpre) changes in average uEPSC peak amplitude including (A, strength) and excluding (B, potency) failures and failure rate (C). Connections that showed LTP (as defined by an increase in normalized strength change, +ΔN strength, p < 0.05, Wilcoxon's test) are shown in red, those that showed LTD (−ΔN strength, p < 0.05, Wilcoxon's test) in blue, and connections whose strength did not change after pairing (p ≥ 0.05, Wilcoxon's test) as gray. D, Changes in strength (black bars), potency (gray bars), and failure rate (white bars) for all studied L4–L4 cell pairs (n = 42). Each group of three bars corresponds to a pair recording experiment sorted by group from lowest ΔN to the left to highest ΔN to the right. Underlined areas indicate pairs that underwent significant depression (blue, n = 19), potentiation (red, n = 7), or no change (gray, n = 16). E, F, Correlations between ΔN strength and ΔN potency (A; R2 = 0.57, p < 0.001) and ΔN failure rate (B; R2 = 0.42, p < 0.001). G, Correlation between ΔN potency and ΔN failure rate (R2 = 0.34, p < 0.001).