Figure 4.
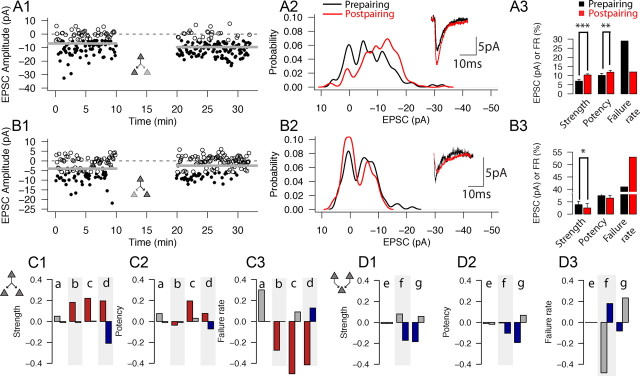
Different plasticity outcomes in connections sharing a common presynaptic or postsynaptic neuron. A, B, Time plots (A1–B1), PDFs (A2–B2), average prepairing and postpairing responses (A2–B2, insets; coupling artifacts removed for clarity), and strength (left), potency (middle), and failure rate (middle) bar plots (A3–B3) for the two sets of cell pairs in a divergent triplet set that share a common presynaptic cell and that were recorded simultaneously. The results for changes in strength, potency, and failure rate for this divergent triplet are summarized in d in C1–C3. A1–A3 show results from the cell pair of the triplet set that underwent LTP (from 6.94 ± 7.14 to 10.31 ± 6.38 pA; p < 0.01, Wilcoxon's test), and B1–B3 show results from the other cell pair of the divergent triplet set (same presynaptic cell, different postsynaptic target cell) from the same triplet set that underwent LTD (from 3.82 ± 5.38 to 2.49 ± 4.53 pA; p < 0.05, Wilcoxon's test). C, Changes in strength (C1), potency (C2), and failure rate (C3) for all four divergent triplet set experiments in which pairs of connections with a common presynaptic cell were recorded and paired simultaneously. Each pair of bars corresponds to the changes for both connections in a triplet. LTP/NC/LTD pairs are indicated by red, gray, and blue bars, respectively. D, Changes in strength (D1), potency (D2), and failure rate (D3) for all three experiments in which triplet sets of connected cell pairs with different presynaptic cells and a common postsynaptic cell were evaluated. Each pair of bars corresponds to the changes for both connections in a triplet; the left bar corresponds to the pair that was recorded and paired first. *p < 0.05, **p < 0.01, ***p < 0.001 by Wilcoxon's test.

