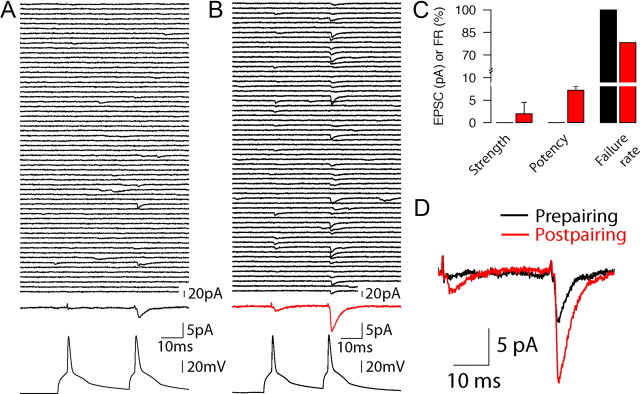
Figure 7.
Example of a connection with 100% initial failure rate that potentiated in response to pairing. A, Sixty example prepairing consecutive traces (top, black), average of all recorded trials (middle, black), and example presynaptic action potentials (bottom, black) of a connection with failure rate of 100% in response to the first action potential in the pair. B, Same as A but after pairing. The average of all recorded trials is shown in red (middle). C, Summary strength (left), potency (middle), and failure rate (right) changes for the connection shown in A and B. D, Superimposed average prepairing (black) and postpairing (red) traces for the connection in A–C.

