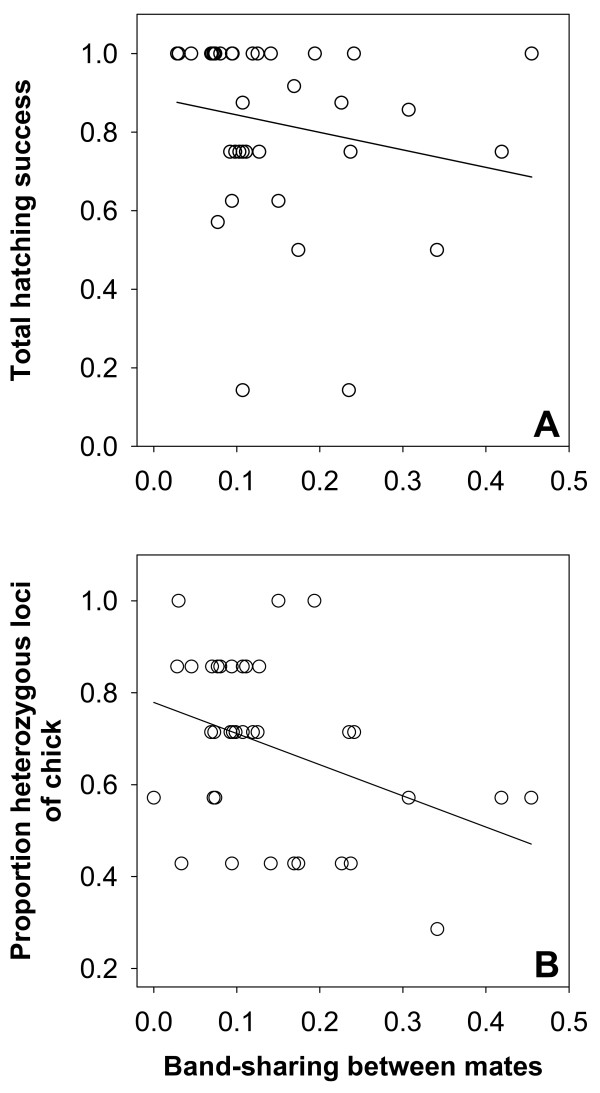
Figure 3.
Hatching success and genetic variation in southern dunlins. (A) Relationship between total hatching success (sum of hatchlings/sum of eggs, including clutches in which at least one egg hatched) and genetic similarity of mates (band-sharing values derived from multi-locus DNA fingerprints), n = 36 pairs; the regression line is shown for descriptive purposes (slope = -0.20, SE = 0.17). (B) Relationship between allelic heterozygosity of chicks (genotyped at 7 microsatellite loci) and genetic similarity of their parents (DNA fingerprinting), n = 37 chicks from 37 different pairs (one randomly selected chick per pair); the regression line is shown for descriptive purposes (slope = -0.38, SE = 0.16).

