
Figure 3.
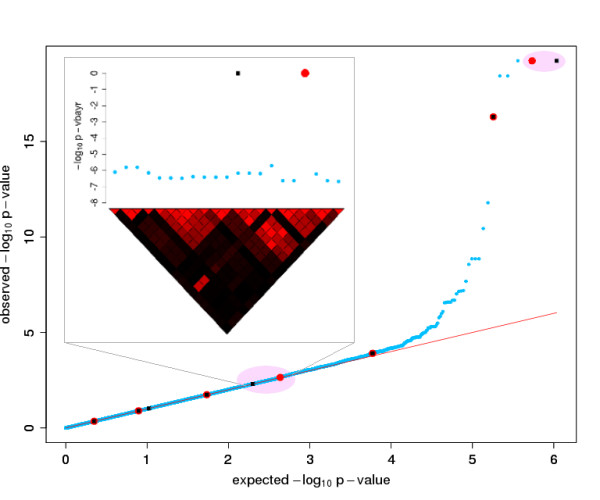
Quantile-Quantile plot of the genome-wide p-values obtained in the single marker analysis of the data presented in Figure 1. The seven associations correctly identified by V-Bay are circled in red. The locations of the loci with phenotype associations (black squares) and the results of the V-Bay analysis (red circles) are depicted with respect to their observed and expected quantiles from the single-marker analysis (blue circles). In this analysis, V-Bay is able to detect true associations that are undetectable with the single-marker analysis. The inset plot shows one of the hits from V-Bay that does not lie exactly on the marker in tightest linkage disequilibrium with the associated locus but is six SNPs away.