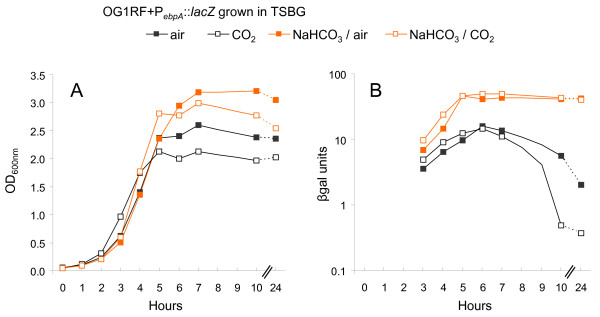
Figure 7.
ebpA expression affected by NaHCO3, and not CO2. For β-gal assays, samples were collected every hour from 3 to 8 hr, then at 10 and 24 hr after starting the culture (x axis). Growth curves of OG1RF containing PebpA::lacZ are shown in air with a thin gray line, in NaHCO3/air with thin orange line, in CO2 with a dense gray line, and in NaHCO3/CO2 with a dense orange line. The β-gal assays for OG1RF containing PebpA::lacZ are represented with closed black square, closed orange square, open black square, and open orange square when the cells were grown in air, 5% CO2, NaHCO3-air, and NaHCO3-5% CO2, respectively. All sets of cultures presented were analyzed concurrently. This figure is a representative of at least two experiments. A. OD600 nm readings. B. β-gal assays (β-gal units = OD420 nm/protein concentration in mg/ml).

