
Figure 3.
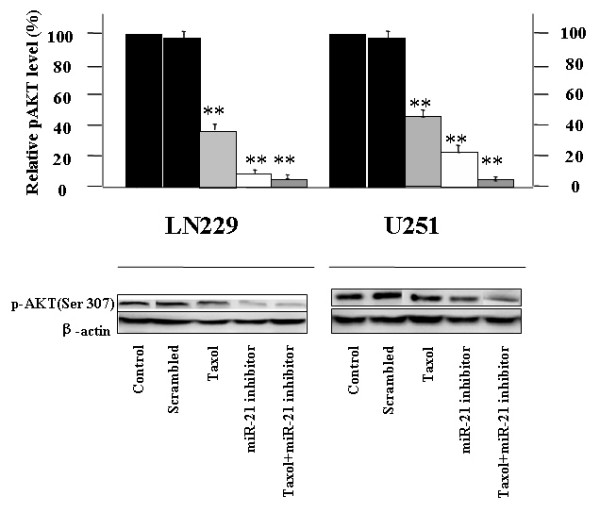
Activity of the AKT pathway in human glioblastoma LN229 and U251 cell lines. Representative Western blots showing the levels of p-AKT expression and the results of densitometric determinations. Significant differences from the control value are indicated by **p < 0.01.