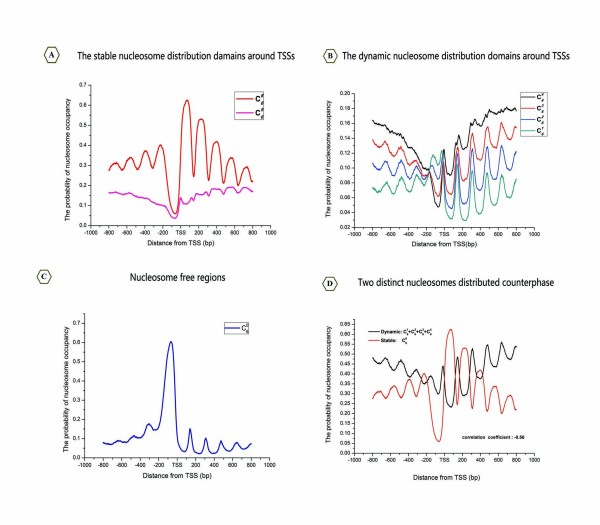
Figure 5.
Decomposition of the nucleosome distribution domains by the BDID model. (A) The stable nucleosome probability distribution profiles, according to the binomial coefficients  and
and  . (B) The dynamic nucleosome distribution profiles, including the curves of
  ,
,  ,
,  and
and  . (C) The distribution of the NRF, profiles
  . (D) The counterphase between the two distinct nucleosome distributions. The dynamic nucleosome probability distribution curve (black) was integrated from
  ,
,  ,
,  and
and  .
.

