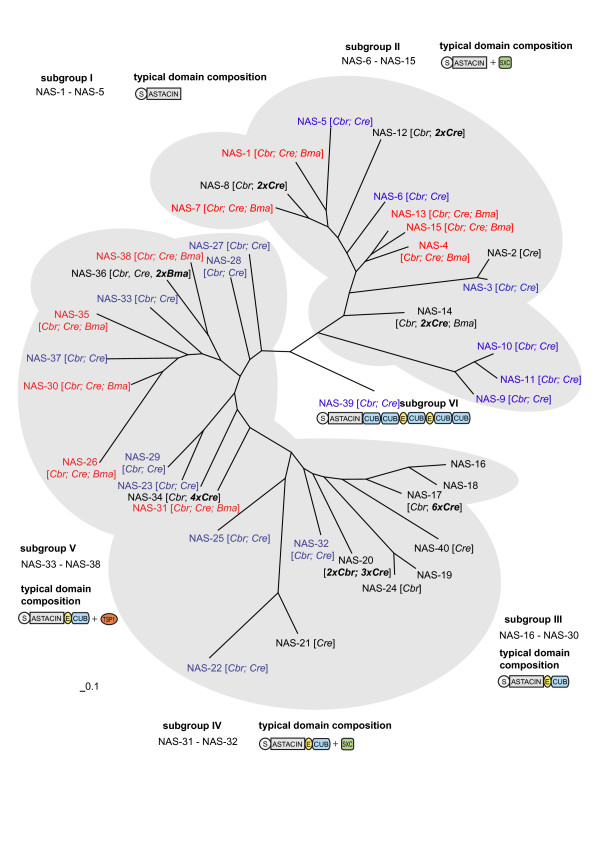
Figure 1.
Phylogenetic relationships of astacins within Nematodes. The tree was deduced by Bayesian analysis based on the alignment of the amino-acid sequences of the catalytic chain, covering the region from Ala-1 to Leu-200 in the prototype, crayfish astacin. The main clusters are shaded: Cluster 1: subgroups I and II; cluster 2: subgroups III-V, The typical domain composition of each cluster is depicted. S: Pre-Pro-Sequences; Astacin: protease domain; EGF: epidermal growth factor like modules; CUB: CUB domain; TSP1: Thrombospondin type 1 domains; SXC: ShK toxin/SXC domain. The scale bar represents a distance of 0.1 accepted point mutations per site (PAM). The number of orthologs in C. briggsae (Cbr), C. remanei (Cre) and B. malayi (Bma) is indicated in brackets. Genes with exactly one ortholog in each of these species are in red, genes missing specifically in B. malayi are indicated in blue, duplicated genes in other species are in bold print.

