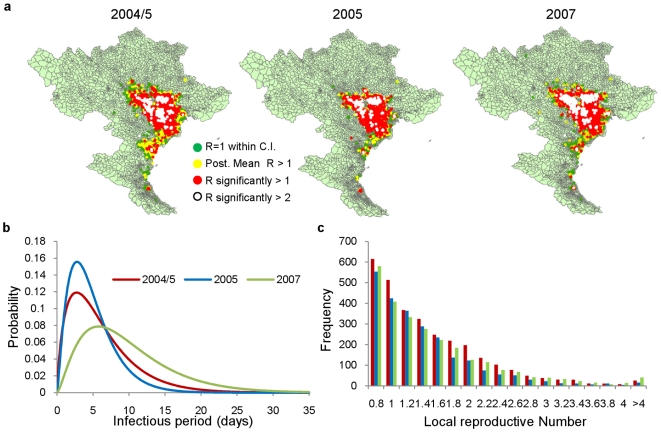
Figure 3. The infectious period and local reproductive numbers.
a, Spatial distribution of local reproductive numbers calculated analytically using the infectivity and infectious period estimates, b, Estimate of probability (assumed gamma) distribution of the infectious period during each of the three waves, c, Histogram of local reproductive numbers for the three waves (only those with values greater than 0.8 plotted).

