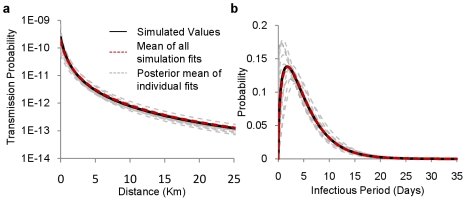
Figure 5. Simulation study results.
Parameters used during simulation of outbreaks waves (black line), estimates from the posterior mean of the model parameters estimated from fitting the model to each simulated wave (dashed grey lines) and the overall mean of each of these estimates (dashed red line) for a, the commune-level infectious period and b, infectiousness over space as described by the product of β and the spatial kernel.

