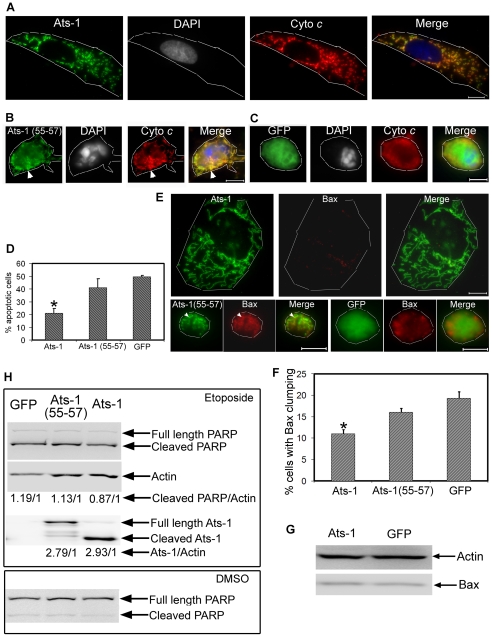
Figure 8. Ats-1 inhibits etoposide-induced apoptosis.
A-C. Triple fluorescence labeling using rabbit anti-Ats-1 [Ats-1 or Ats-1(55–57); Alexa Fluor 488, green], mouse monoclonal anti-cytochrome c (Cyto c; Alexa Fluor 555, red), and DAPI (nucleus, gray pseudocolor) in RF/6A cells transfected with pAts-1 (Ats-1) (A), pAts-1 (55–57) [Ats-1(55–57)] (B), or pGFP (GFP) (C), after treatment with etoposide. Scale bar: 10 µm. Note mitochondrial colocalization of Ats-1, a large nucleus, and a spread-out large RF/6A cell in A, and round-up shrunken RF/6A cells with condensed nuclei and presence of diffuse cytochrome c released into the cytosol in B and C. Some Ats-1 (55–57) is colocalized with cytochrome c retained in the fragmented mitochondria in B (white arrowhead). Contours of host cells are marked with white dashed lines. D. Percentage of apoptotic cells in RF/6A cells transfected with pAts-1 (Ats-1), pAts-1 (55–57) [Ats-1(55–57)], or pGFP (GFP) 1 day after etoposide treatment. Data are presented as means ± standard deviations of triplicate samples. *, significantly different compared with GFP-, or Ats-1(55–57)-expressing RF/6A cells by the Tukey's HSD test (P<0.01). E. Bax staining for RF/6A cells transfected with pAts-1 (Ats-1), pAts-1(55–57) [Ats-1(55–57)], or pGFP (GFP) 1 day after etoposide treatment. Note clumped Bax in the round-up shrunken pAts-1(55–57)- and pGFP-transfected cells, and weak diffuse Bax (almost invisible) in pAts-1-transfected cells, and absence of Bax colocalization with Ats-1 in the mitochondria. In pAts-1(55–57)-transfected cells some Bax is colocalized with Ats-1(55–57) retained in the fragmented mitochondria (white arrowhead). Bar: 10 µm. Contours of host cells are marked with white dashed lines. F. Percentage of RF/6A cells transfected with pAts-1(Ats-1), pAts-1(55–57) [Ats-1(55–57)], or pGFP (GFP), showing obvious Bax redistribution (clumping) 1 day after etoposide treatment. Data are presented as means ± standard deviations of triplicate samples. *, significantly different compared with GFP-, or Ats-1(55–57)-expressing RF/6A cells by the Tukey HSD test (P<0.01). G. Bax amount in RF/6A cells transfected with pAts-1(Ats-1), or pGFP (GFP) 1 day after etoposide treatment. Actin is used to normalize the protein loading amount. H. Western blot analysis for cleavage of PARP in RF/6A cell transfected with pAts-1 (Ats-1), pAts-1(55–57) [Ats-1(55–57)], or pGFP (GFP) after treatment with etoposide or DMSO for 12 h. Samples were subjected to probing with anti-PARP, anti-actin, or anti-Ats-1 by Western blot analysis. Full-length and cleaved PARP, actin, full-length and cleaved Ats-1 are indicated with arrows. Relative density ratios of cleaved PARP/actin bands, or total Ats-1 (full length, cleaved and degraded Ats-1)/actin bands are shown below each lane in etoposide-treated group.

