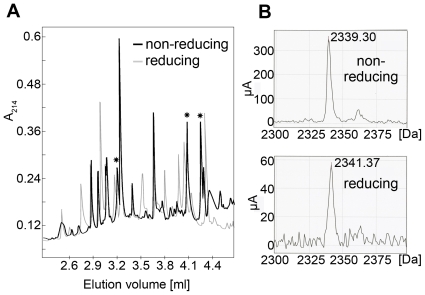
Figure 5. Disulfide mapping strategy.
A) Typical HPLC elution profile of a tryptic digest of E2e under non-reducing (black) and reducing (light grey) conditions, superposed to highlight the difference in mobility upon reduction. Asterisks mark peaks that disappeared upon reduction and were thus selected for further proteomic analysis. B) Mass spectrum of a sample recovered from an HPLC peak susceptible to reduction (Peak 16-3 of JFH-1 E2 identified as peptide J4 in the detailed description provided in SI). Upon reduction, a shift in molecular mass of 2Da was observed, due to addition of two hydrogen atoms upon reduction of the two cysteines. The data presented in this figure allowed the identification of disulfide 4 (Table 2).

