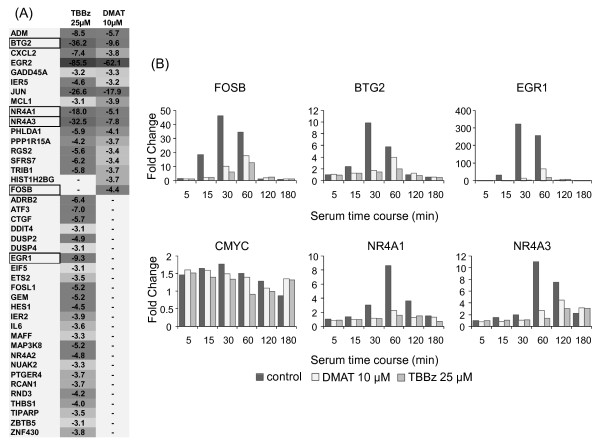
Figure 2.
Changes in gene expression induced by TBBz and DMAT. (A) List of 42 genes and fold change in their expression in response to treatment with inhibitors (1 hr) were analyzed by the Affymetrix U133A 2.0 GeneChip microarray. Dark grey indicates a high decrease and light grey lower decrease in expression. Expression of the boxed genes was confirmed by real time PCR and is presented as fold change at zero time (B).

