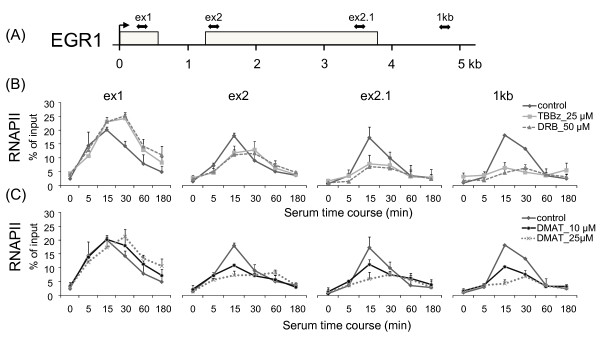
Figure 3.
TBBz and DMAT arrest RNAPII elongation along the EGR1 locus after serum treatment. (A) Position of primers relative to transcription start sites (in bp): exon 1 +248; exon 2 +1287; exon 2.1 +3490; 1 kb +4528. (B, C) HeLa cells maintained for 48 h in 0.5% serum were treated with fresh medium supplemented with 15% FBS and -/+ 25 μM TBBz/50 μM DRB/10 or 25 μM DMAT (C) for the indicated times and then used in ChIP assays with antibodies to RNAPII. Purified DNA was used in real-time PCR with pairs of primers spanning the EGR1 locus. The density of RNAPII on the EGR1 gene was quantified by real-time PCR and is presented as a percentage of input. Data represent means ± S.D from 3 independent experiments.

