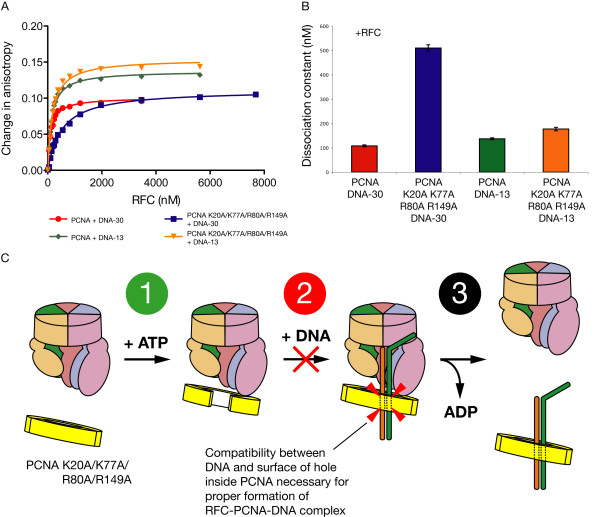
Figure 4.
Affinity of RFC and mutant PCNA for DNA as measured by fluorescence anisotropy. (A) Fluorescence anisotropy binding curves for RFC titrated into a mixture of 1 μM PCNA (or PCNA K20A/K77A/R80A/R149A) and 100 nM TAMRA-labeled DNA-30 (30 base pairs in the duplex region) or DNA-13 (13 base pairs in the duplex region) in the presence of 1 mM ATP-γ-S. Curves represent best fit to a one-site binding equation (see Methods). (B) Bar graph presenting dissociation constants of binding data from Figure 4A. Error bars represent standard error of the curve fit. (C) The clamp loader cycle is broken into three parts; fluorescence anisotropy binding data suggests that step 2 of the cycle, the formation of the RFC-PCNA-DNA ternary complex, is hindered by PCNA K20A/K77A/R80A/R149A through the loss of compatibility between DNA and the surface of the clamp's hole.

