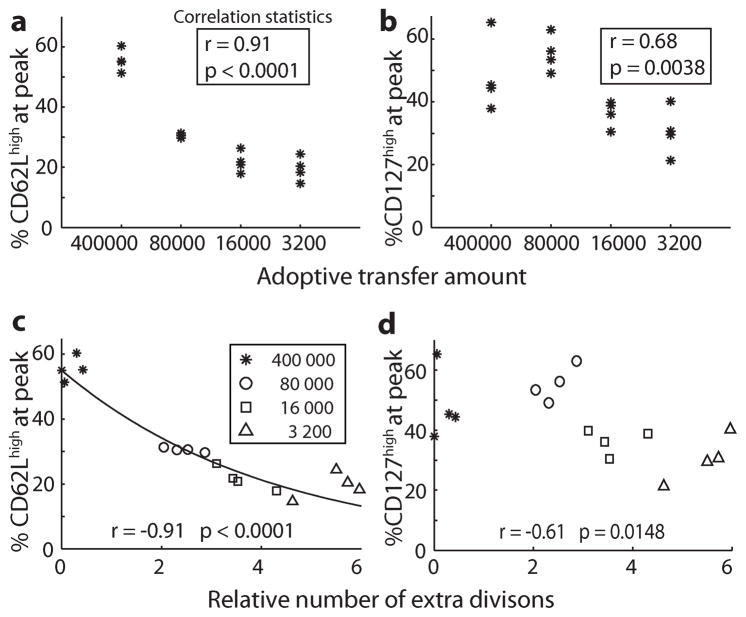
Figure 2. Adoptive transfer number and cell division affects phenotype.
400000, 8000, 1600 and 3200 naïve OT-1 T cells were transferred into naïve mice which were subsequently infected with LM-OVA. The percentage OT-1 cells and phenotype were measured at the peak of the response in each animal. There was a significant positive correlation between the proportion of cells CD62Lhigh and adoptive transfer amount (A), and the percentage of cells CD127high and adoptive transfer amount (B) (Spearman’s tied-rank correlation). The relative number of extra divisions required by different mice to achieve the peak of their response (compensating for different adoptive transfer numbers) was calculated (C, D). There was a significant negative correlation between the relative number of extra divisions, and both the percentage of cells CD62Lhigh (C) and the percentage of cells CD127high (D) (Spearman’s rank correlation). The predicted relationship between CD62L expression and division number using a division-linked mechanism where 21.2% (median value from between mice, figure 3) of the CD62Lhigh population becomes CD62Llow with each division is overlaid in panel (solid line in panel C).

