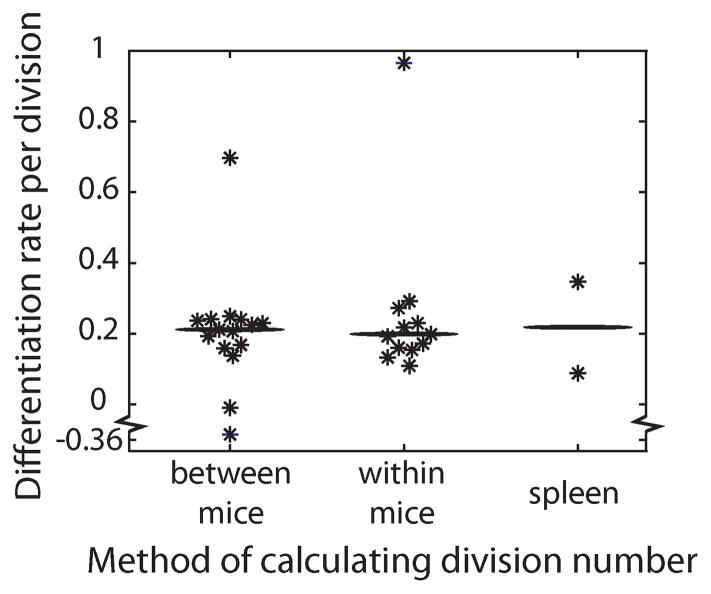
Figure 3. Estimating the proportion of CD62Lhigh cells that become CD62Llow on each division.
The rate of differentiation (c) from CD62Lhigh to CD62Llow per division was calculated with three methods. In the first, the relative extra number of divisions to reach the peak proportion of OT-1 cells calculated between mice taking into consideration the adoptive transfer amount (n = 15, median c value = 0.212 [indicated by horizontal bar]). The second method calculates the number of divisions from the first day of measurement to the peak of infection in individual mice (n = 12, median c value = 0.199). The third calculates the number of divisions cells undergo in the spleen (n = 2, mean c value = 0.218).

