
Figure 8. Visualization of various stages of replication by DNA fiber combing and immunostaining.
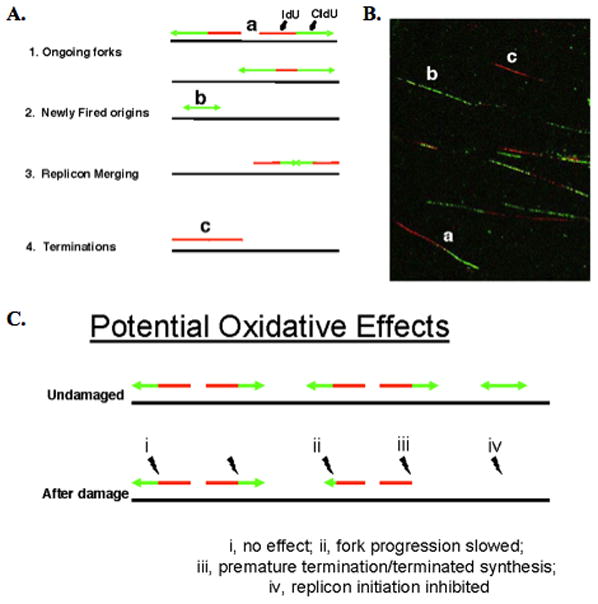
(A) Schematic illustration of results expected when genomic DNA from asynchronous cells (pulsed for 10 min with IdU followed by 20 min pulse with CldU) is aligned and straightened on a glass slide (fiber spread); the incorporated halogenated nucleotides are visualized by immunofluorescence. The various stages of DNA synthesis can be inferred by the presence and relative position of single and/or double-labeling in continuous replication tracks. The small letters in the schematic refer to the actual tracks illustrated in B. (B) Field of replication tracks as detected by fluorescence microscopy, containing representative examples of labeling. (C) Illustration of possible oxidative DNA damage effects on the various stages of replication.