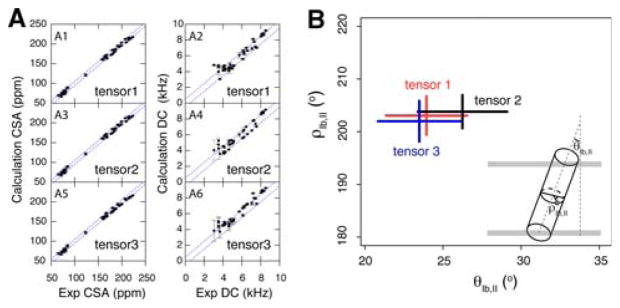
Fig. 6.
a Comparison of the experimental and calculated CSA and DC for different values of the CSA tensor components shown in Table 1. The diagonal errors indicate ranges of ±5 ppm and ±0.5 kHz for CSA and DC, respectively. b Effects of the different CSA tensor components on the tilt and rotation angles for the helix defined by domains Ib and II of PLN. Tensors 1 (Wu et al. 1995), 2 (Page et al. 2008), and 3 are shown in red, black, and blue, respectively

