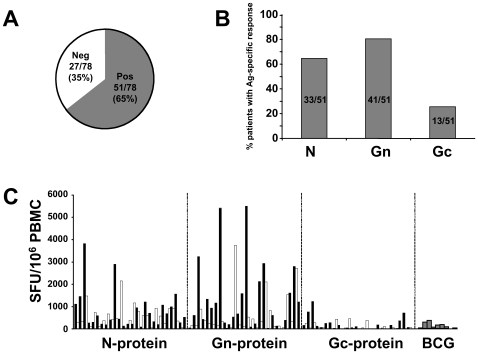
Figure 1. Distribution of ANDV-specific memory T-cell responses.
(A) Summary of the determination of ANDV-specific T cells ex vivo IFN-γ ELISPOT assay in a total of 78 ANDV-convalescent patients. According to the criteria for positivity (see material and methods) only 51/78 (65%) displayed a positive response. Alternating black and white bar graphs (one bar represents one individual) are used for better visibility. (B) Differential recognition of ANDV antigens among the 51 responsive patients, indicating the relative immunodominance of Gn- as compared to N- and Gc-protein. (C) Individual T-cell responses to the different ANDV-antigens and BCG. Triplicates of PBMC of each patient were challenged in a 38-hour IFN-γ ELISPOT by a total of 13 pools of overlapping peptides, spanning the entire N- (aa 1–430), Gn- (aa 1–650) and Gc- (aa 641–1140) protein of Chilean ANDV. Most patients showed significant responses towards the Gn-antigen (aa 1–650). Each bar represents the sum of mean triplicate responses towards the peptides representing a given antigen. Depiction of standard-deviations was avoided to facilitate the visibility of results. The overall mean response to ANDV was 1805 SFU/106 PBMC.

