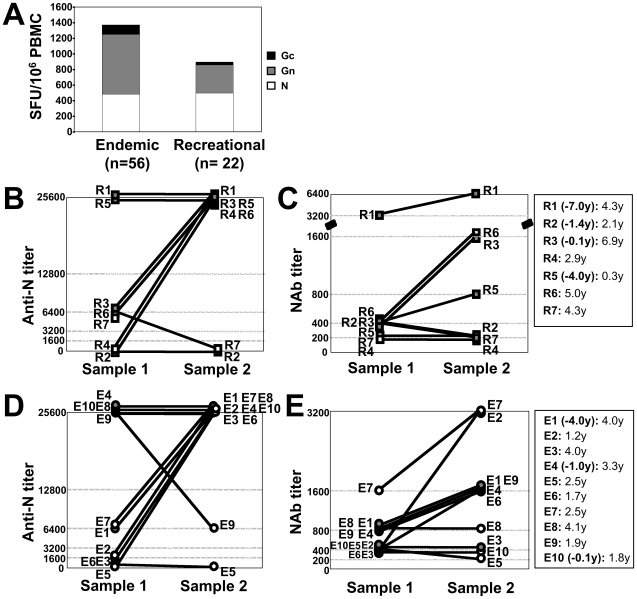
Figure 7. Comparison of immune responses between patients residing in endemic areas (E-patients) and those who got infected during recreation (R-patients).
(A) no significant differences in memory T-cell responses between E- and R-patients. (B-E) prospective anti-N (determined by indirect ELISA) and NAb titers (determined by FRNT) in R-patients (B, C) and E-patients (D, E), respectively. Symbols filled in grey indicate patients in who sample 1 was taken months or years after the acute infection; the time difference between the acute phase and the timepoint of sample 1 is indicated as negative number in parenthesis (legend on the right). The second number indicates the time period between sample 1 and sample 2, respectively.

