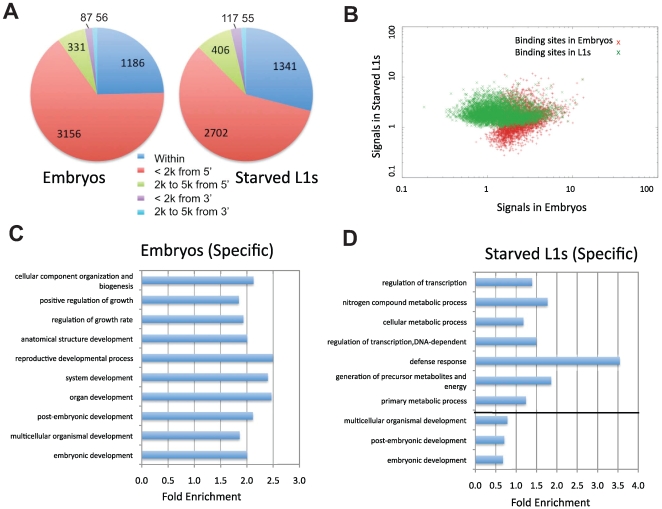
Figure 5. Characterization of PHA-4 binding patterns and gene targets.
(A) The distribution of the distance between PHA-4 binding sites and candidate gene targets (Figure S3 for algorithm for assigning gene targets). (B) Scatter plot comparing similarity and uniqueness of PHA-4 binding profile in embryos and L1 larvae. Signal strength is sequenced reads normalized against input in the peak region (p<10−5). (C,D) Gene Ontology (GO) categories showing the highest level of enrichment for the candidate target genes of PHA-4 specific to embryos (C) and L1 larvae (D). Fold enrichment is defined as the increase in abundance in the immunoprecipitated sample relative to total input chromatin.

