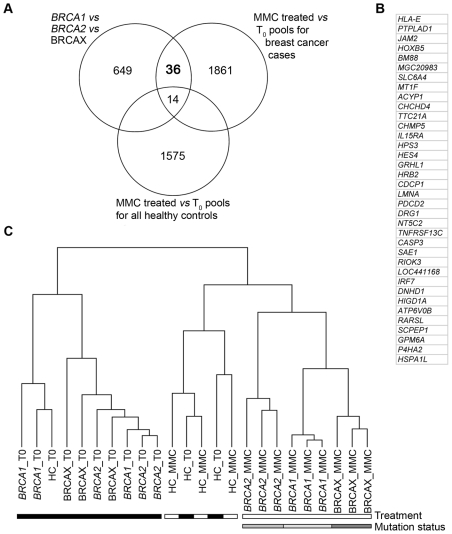
Figure 2. Classifying BRCA1, BRCA2, and BRCAX subtype by MMC response genes.
(A) Venn diagram illustrating the number of genes identified from three analyses: 1) 3-way comparison of BRCA1, BRCA2 and BRCAX pools (F-test, P<0.05); 2) Pairwise comparison of 1.2 µM MMC-T60 treated and non-treated BRCA1/2/X pools (<10% false discovery rate; 90% confidence level); and 3) 2-way comparison of 1.2 µM MMC-T60 treated and non-treated healthy control pools (T-test, P<0.05). The extent of overlap between gene lists is shown. (B) List of 36 genes that are differentially expressed between BRCA1, BRCA2, and BRCAX, and are MMC responsive in affected carrier pools but not in healthy controls. (C) Supervised hierarchical clustering of treated (1.2 µM MMC-T60) sample pools using the 36-gene list.

