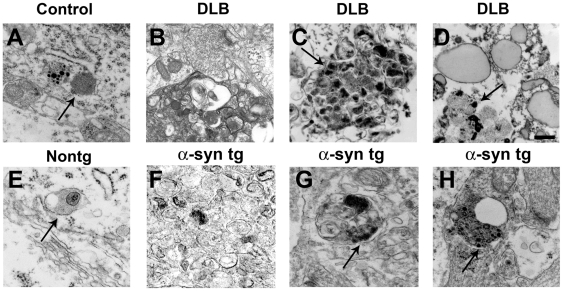
Figure 4. Electron microscopic analysis of abnormal autophagosomes in patients with DLB and in α-syn tg mice.
(A) Representative image from a non-demented control case showing normal neuronal lysosomes (arrow). (B–D) Abnormal autophagosomes and accumulation of electrodense deposits (arrows) in intraneuronal membrane-bound structures in the brains of patients with DLB. (E) Representative image from a non tg mouse brain showing normal neuronal lysosomes (arrow). (F–H) Abnormal autophagosome morphology and accumulation of electrodense deposits (arrows) in intraneuronal membrane-bound structures in the brains of α-syn tg mice. Scale bar in panel (C) represents 0.5µm in all panels.

