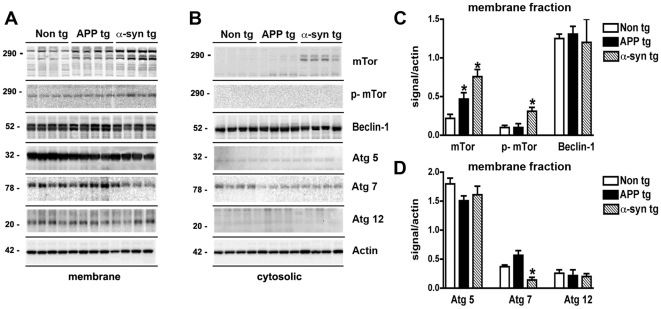
Figure 5. Immunoblot analysis of the autophagy pathway in the brains of APP and α-syn tg mice.
Brain homogenates from non tg, APP tg, and α-syn tg mice were separated into membrane and cytosolic fractions, and 20 µg of each sample was subjected to gel electrophoresis. Immunoblots were probed with antibodies against mTor, phosphorylated (p) mTor, Beclin-1, Atg5, Atg7, Atg12 and Actin. (A) Representative immunoblots of membrane fractions. (B) Representative immunoblots of cytosolic fractions. (C) Semi-quantitative analysis of levels of mTor, p-mTor, and Beclin-1 in membrane fractions from the brains of non tg, APP tg and α-syn tg mice. Levels of mTor were significantly increased in APP tg and α-syn tg brains. (D) Semi-quantitative analysis of levels of Atg5, Atg7, and Atg12 in membrane fractions from the brains of non tg, APP tg and α-syn tg mice. Levels of Atg7 were significantly reduced in the brains of α-syn tg mice. All semi-quantitative measurements were normalized to actin levels as a loading control. *p<0.05 compared to non tg controls by one-way ANOVA with post-hoc Dunnett's test.

