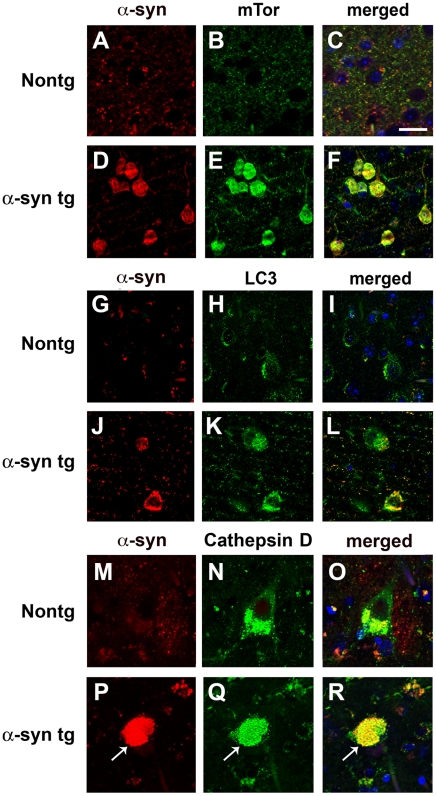
Figure 7. Double-immunolabeling analysis of autophagy and α-syn in the brains of α-syn tg mice.
Vibratome sections from the brains of non tg and α-syn tg mice were immunolabeled with antibodies against α-syn, and co-labeled with antibodies against mTor, LC3 or Cathepsin D, and imaged with a laser scanning confocal microscope. All images are from the temporal cortex. (A–D) Double-immunolabeling analysis showing increased mTor immunoreactivity in α-syn-positive neurons in α-syn tg mice. (G–L) Double-immunolabeling analysis showing increased LC3 immunoreactivity in neurons of α-syn tg mice showing α-syn accumulation. (M–R) Double-immunolabeling analysis showing enlarged Cathepsin D-immunoreactive lysosomes (arrows) in neurons of α-syn tg mice showing α-syn accumulation. Scale bar in panel (C) represents 20µm in panels A–L and 10µm in panels M–R.

