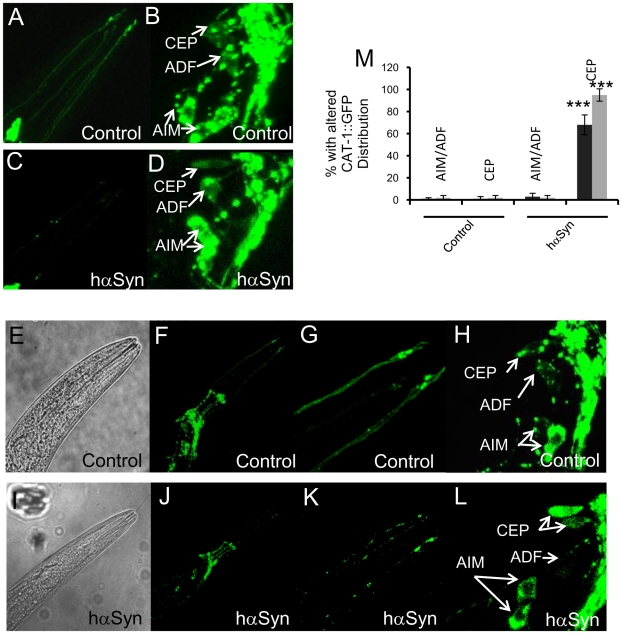
Figure 4. hαSyn expression disrupts dopamine synaptic vesicle distribution.
A–L, Typical confocal laser scanning VMAT/CAT-1::GFP (A–D, F–H, J–L) or bright field (E, I) images of living L2 (A–D) or L4 (E–L) nuls26 (a worm line expressing VMAT-CAT-1::GFP) worms expressing (C–D, I–L) or not expressing (A–B, E–H) hαSyn. A–D, are GFP images that show DAergic (CEP, specifically) dendrites (A, C) or DAergic/serotonergic somas (B, D) of L2 worms. G and K are magnified areas of F and J, respectively, that show DAergic dendrites (CEP) of L4 worms. H and L, are magnified areas of F and J, respectively, that show DAergic and serotonergic somas of L4 worms. M, Quantification of CAT-1::GFP redistribution in DAergic neurons (CEP) and serotonergic neurons (AIM and ADF) of L2 (black bars, n = 5) and L4 worms (gray bars, n = 8). ***: p<0.0001 (t-test). Error bars indicate SEM.

