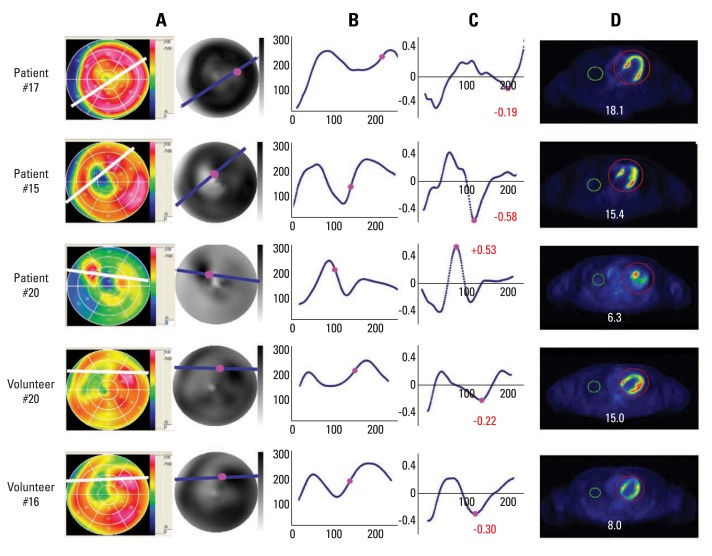
Fig. 1.
Representative images of cardiac FDG-PET and Smax in patients with myocardial ischemic event as well as healthy volunteers. Myocardium in patient #17 was defined as viable by an echocardiogram under low dose of dobutamine stress. Myocardium in patient #15 and #20 were defined as not viable. (A) FDG bull's eye mapping (colored and gray scaled). Low uptake regions were observed in both patients (#17, #15, and #20) and healthy volunteers (#20 and #16). (B) FDG plot profile along white and blue lines in the panel A. (C) Changing rate of FDG gray scale per pixel along the line. Absolute values (red) indicate Smax values. The pink dots in the panels A, B, and C indicate the location of Smax. (D) Hmax/Lmax values are shown. FDG, cardiac 2-[F-18] fluoro-2-deoxy-D-glucose; PET, positron emission tomegraphy.

