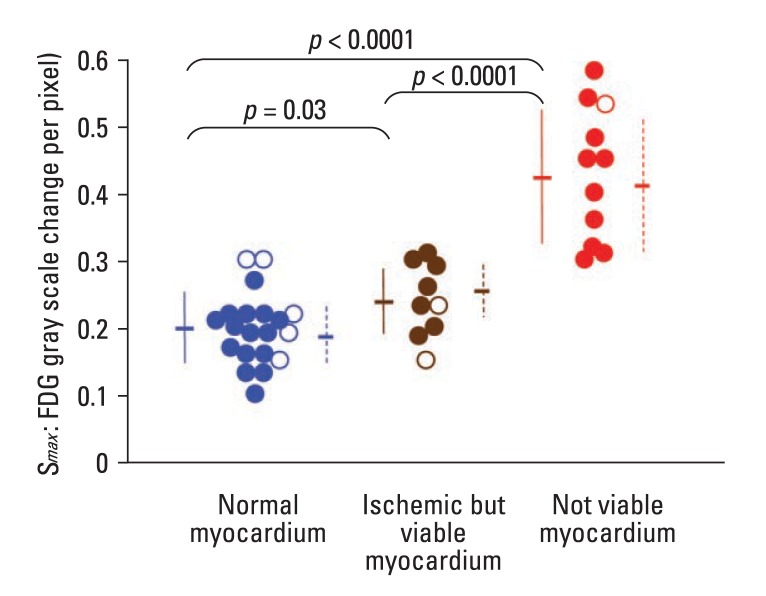
Fig. 2.
Difference of Smax in three myocardial conditions. The Smax is the highest in the not viable myocardium (red circles), intermediate in ischemic but viable myocardium (brown circles), and the lowest in normal myocardium (blue circles). Closed circles and solid lines (mean ± SD): data from the subjects with Hmax/Lmax ≥10. Open circles: data of the subjects with Hmax/Lmax < 10. Dashed lines (mean ± SD) were analyzed by including all data (both Hmax/Lmax≥10 and <10).

