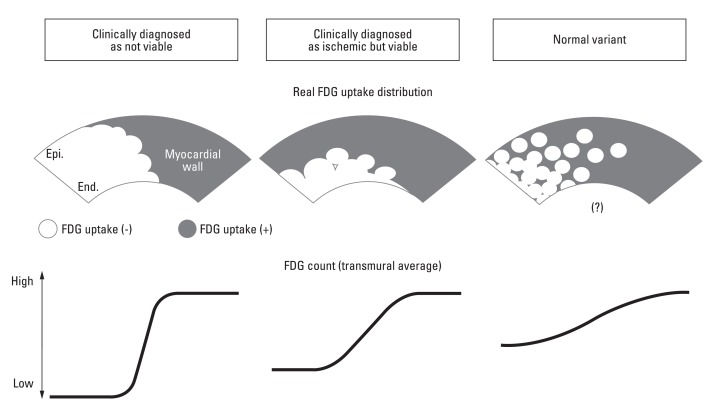
Fig. 4.
Schematic diagram of real FDG uptake in the myocardial wall and FDG-PET count. Gray area: positive FDG uptake. White area: negative FDG uptake. Voxel size of the PET scanner in the present study was 3.3×3.3×3.3 mm3. FDG count is displayed as its average of that in the transmural wall. Steepness of the FDG slope at the border zone of the low uptake region is different for not viable myocardium, ischemic but viable myocardium, and normal variant (speculated). FDG, cardiac 2-[F-18] fluoro-2-deoxy-D-glucose; PET, positron emission tomegraphy.

