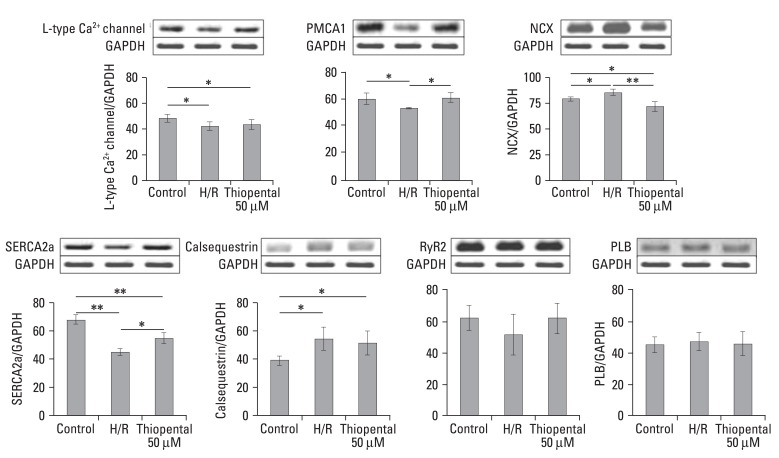
Fig. 4.
Analysis of gene expressions related to Ca2+ homeostasis. mRNA expression of genes was established by separating amplification products by agarose gel electrophoresis and visualizing them by ethidium bromide staining. Values were normalized to GAPDH before calculating changes. Data is presented as mean ± S.E.M. above 2-3 replicate measurements in three different cell cultures (n = 6). Control: normal cardiomycytes. H/R: hypoxia-reoxygenated cardiomyocytes. *p < 0.05, **p < 0.01. PMCA1, sarcolemmal Ca2+ pump; SERCA2a, sarcoplasmic reticulum Ca2+-ATPase; NCX, Na+-Ca2+ exchanger; PLB, phospholamban; RyR2, ryanodine receptor; GAPDH, glyceraldehyde-3-phosphate dehydrogenase.

