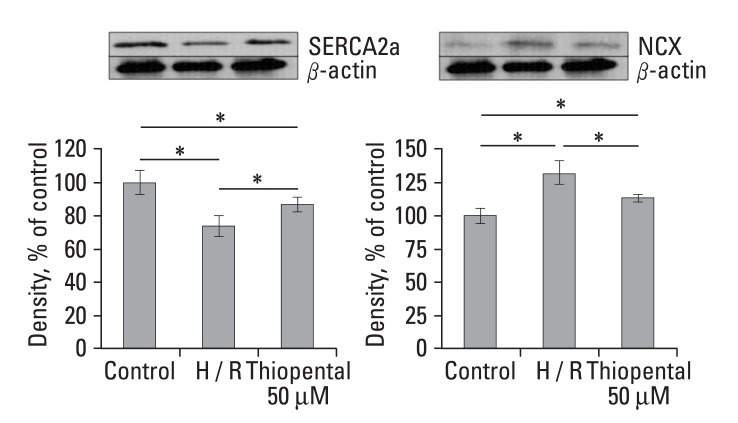
Fig. 5.
Effect of thiopental (50 µM) on Western blot analysis of SERCA2a and NCX. Each signal was quantified by scanning densitometry. Values were normalized to β-actin before calculating changes. Data is presented as mean ± S.E.M. above 2 - 3 replicate measurements in 3 cell cultures (n = 7). Control: normal cardiomycytes. H/R: hypoxia-reoxygenated cardiomyocytes. *p < 0.05.

