Fig. 1.

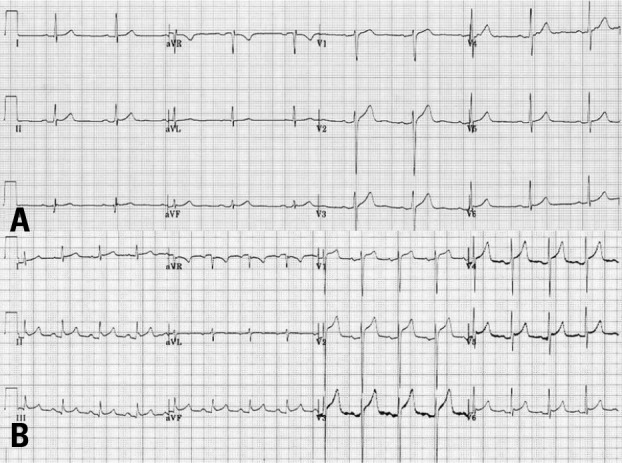
A 12-lead electrocardiogram of the patient. (A) The ECG before the percutaneous coronary intervention, (B) The ECG after the percutaneous coronary intervention. The ECG showed widespread concave ST segment elevations.

A 12-lead electrocardiogram of the patient. (A) The ECG before the percutaneous coronary intervention, (B) The ECG after the percutaneous coronary intervention. The ECG showed widespread concave ST segment elevations.