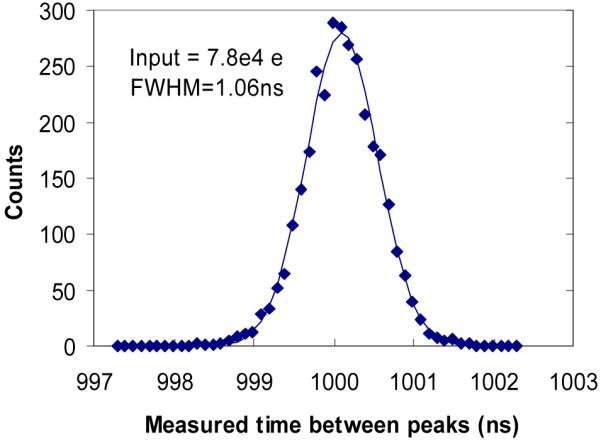
Fig. 7.

The histogram of measured time intervals between the events generated by a pulse generator, shown in Fig. 6. Distance between the pulses was 1 μs, the input charge into single channel 7.8×10⁴ electrons. The solid line is the Gaussian curve with 1.06 ns FWHM that fit the measured data.
