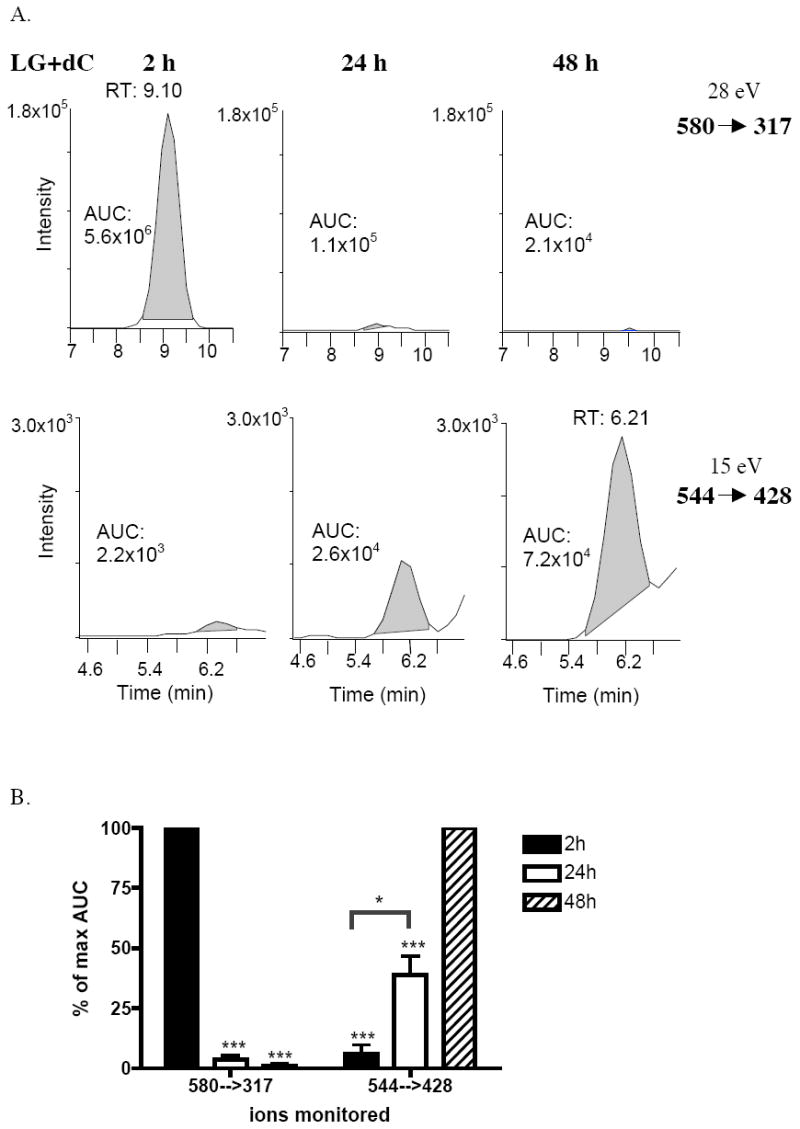
Figure 4.

The ion at m/z = 580 disappears over time, while the ion at m/z = 544 appears. LGE2 was incubated in a 2:1 ratio with dC at pH = 7 and allowed to incubate for 2 h, 24 h, or 48 h at 37°C. Samples were immediately frozen following the time point and analyzed at a later date by ESI-LC/MS/MS, using SRM. The parent ions at m/z = 580 and m/z = 544 were analyzed in the same run. (A) Shown is the chromatograph of one fragment ion for each precursor ion from one experiment, along with the results of peak integrations. (B) The results of three separate experiments were expressed as a percent of the maximum integrated area from each experiment, corresponding to the 2 h time point for the ion at m/z = 580 and the 48 h time point for the ion at m/z = 544. These values are summarized by the mean (n = 3) and standard error. ***, p<0.001 from maximum AUC and *, p<0.05 by one-way ANOVA followed by Bonferroni’s multiple comparisons test.
