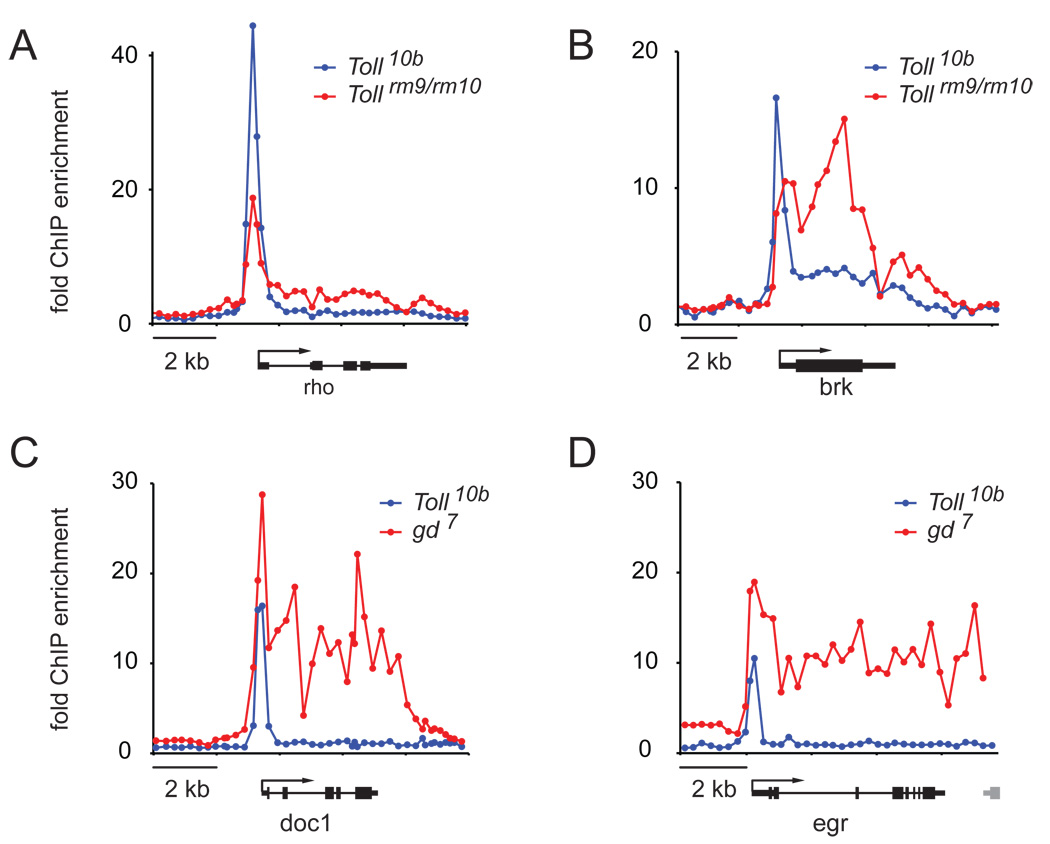
Fig. 5. Pol II profile comparison of genes in the repressed vs. active state.
Genes are shown that are repressed in Toll10b embryos but are active in either Tollrm9/Tollrm10 embryos (A, B) or gd7 embryos (C,D) at 2–4 h after fertilization, were examined by Pol II ChIP assays. The enrichment ratios of Pol II are shown on the y-axis: active state (red) and repressed state (blue). The results show that the degree of Pol II stalling is dependent on the gene’s activity, with some genes showing a complete switch between the stalled and active form of Pol II.

