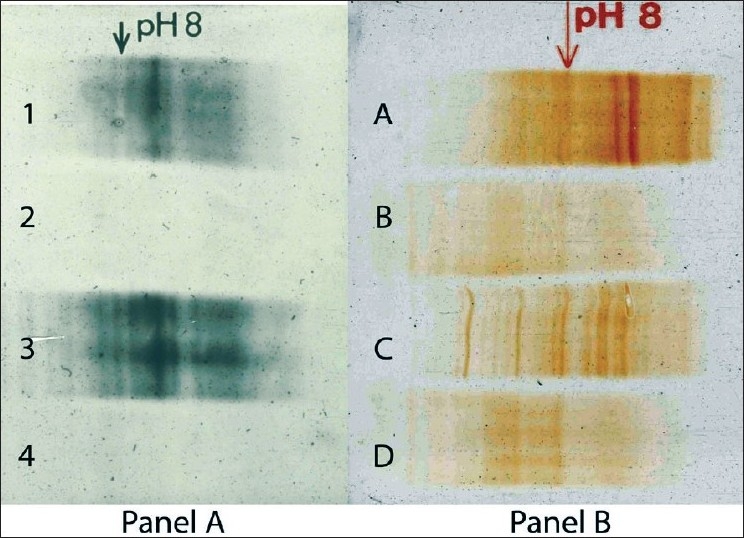
Figure 1.

CSF from MS and nonMS subjects were examined by isoelectric focusing on Agarose gels. One half of the run was processed by silver staining (Panel A) and the other half by immunoblot analysis (Panel B). Lanes 1 and A, and lanes 3 and C represent CSF from 2 patients with MS and lanes 2 and B and 4 and D from 2 nonMS subjects. Note the improved resolution of the immunoblot gels
