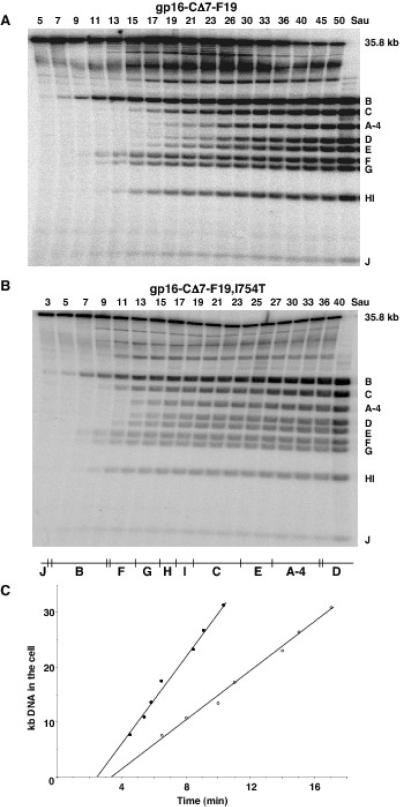
Fig. 6.
Southern hybridizations showing time-courses of A: T7 Δ16 [gp15-M597I,gp16-CΔ7-F19] genome internalization at 30°C in chloramphenicol-treated IJ1133(pTP166) cells and B: T7 Δ16 [gp15-S560P,D614Y, gp16-I754T,CΔ7-F19] in chloramphenicol- plus rifampicin-treated cells. The ratio of infecting particles to cells was 0.4. Lanes labeled Sau were digested with Sau3A I as a control for the amount of T7 DNA in each experiment, all other samples were digested with DpnI. C: rates of genome entry from the experiments shown in A (open circles) and B (closed circles). A schematic Sau3A I/Dpn I map of the phage genomes is shown, A-4 denotes the 4 kb deletion of gene 16 that affects the Dpn I A fragment of wild-type T7 DNA.

