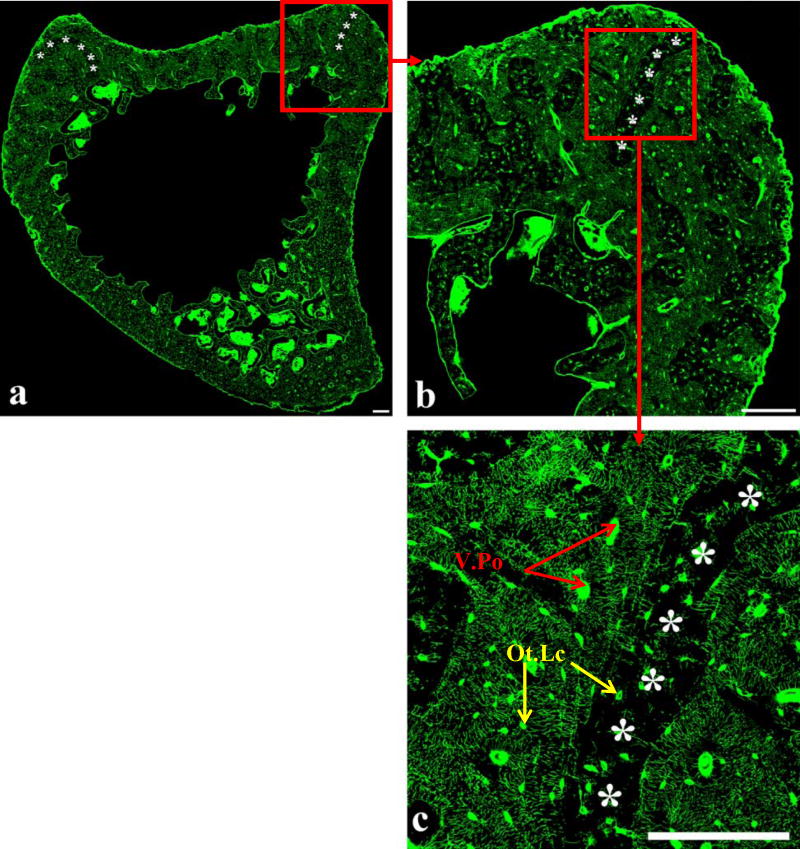
Figure 2.
(a) Reconstructed section from the metaphysis of the rat tibia, and enlargement of the areas delineated by the red squares (b, c). The reconstructed image enables visualization of bone macrostructure, the complexity of the lacunar-canalicular system, and areas with low canalicular density (asterisks). In (c) it is possible to clearly distinguish the inhomogeneous distribution of the lacunar-canalicular system, with areas of low canalicular density (asterisks) and areas of high canalicular density. Osteocyte lacunae (Ot.Lc) and vascular porosity (V.Po) are indicated in (c). Scale bars 60 μm.

