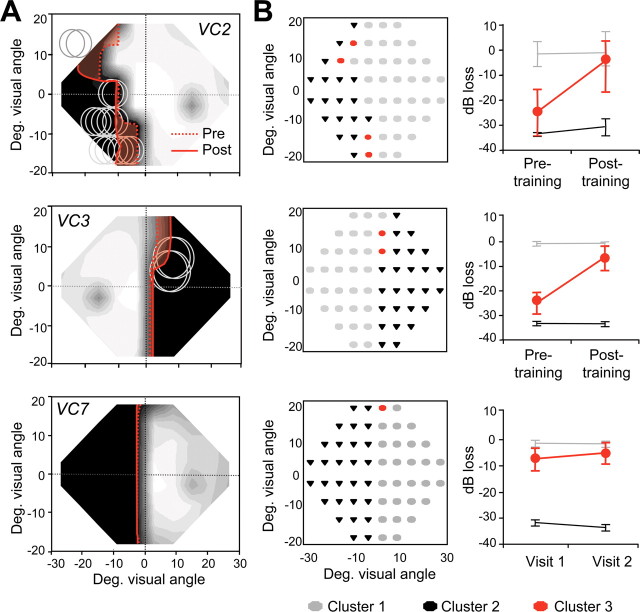
Figure 4.
Global motion discrimination training decreases the size of Humphrey visual field defects. A, Composite Humphrey visual maps obtained in VC2 and VC3 after global direction discrimination training at locations denoted by gray circles and, in VC7, more than 1 year after his initial examination. The solid red lines outline the 5 dB contour line after training or during visit 2 for VC7. Note that for VC2 and VC3 (but not for VC7), this border had receded significantly (shaded red area) from the 5 dB pretraining border (dotted red line), although the posttraining Humphrey maps were obtained 30 or more months after stroke. Color conventions and scaling for the composite maps are as in Figure 1 and supplemental Figure S1 (available at www.jneurosci.org as supplemental material). Enlargements of the visible field always overlapped with retrained locations. B, Cluster analysis of Humphrey visual fields for VC2, VC3, and VC7, illustrating the change in mean pattern deviation for different field locations over time. The left graph in each pair color codes the visual field locations assigned to each cluster. The right graph then illustrates the mean pattern deviation (in decibels) for each cluster across time. Light gray (Cluster 1) represents visual field locations within the normal range of visual sensitivity; black (Cluster 2) represents areas of lost function in which luminance sensitivity did not change significantly over time. Red (Cluster 3) represents a third pattern of change across time for each participant. It can be seen that, in the case of VC2 and VC3, this third pattern was an improvement from pretraining to posttraining time points. In the case of patient VC7, this third pattern represents a significantly smaller change between the two visual field tests administered than was observed in patients who underwent training (such as VC2 and VC3). Deg., Degree.

