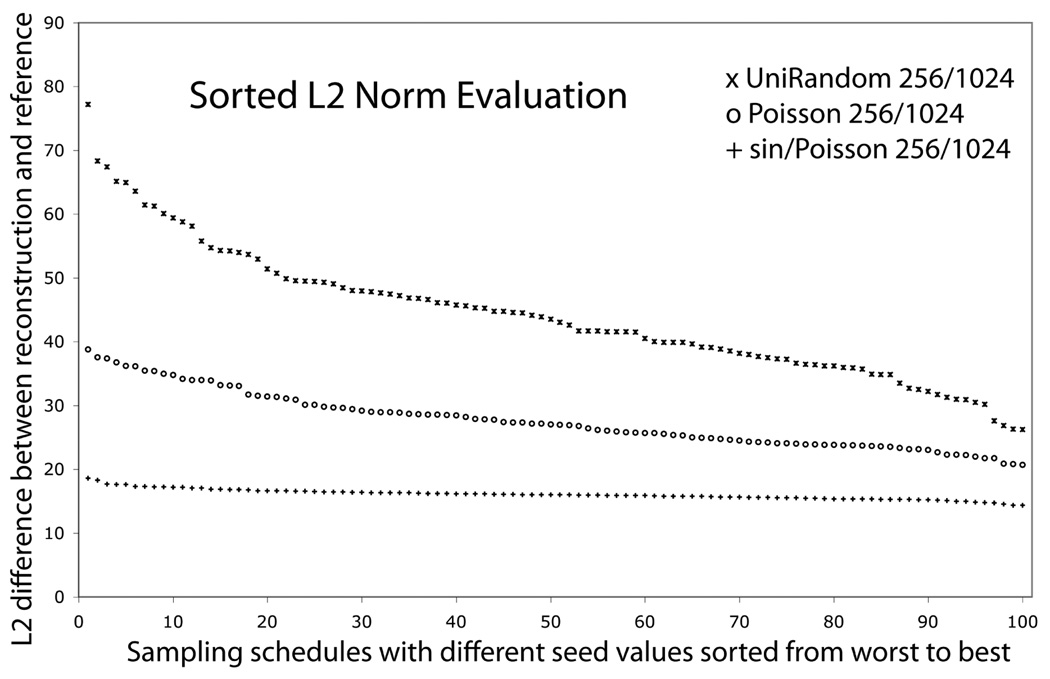
Figure 1.
Effect of Poisson-Gap sampling on the quality of spectra obtained with FM reconstruction. A synthetic time-domain signal (1024 data points) was created and 256 sampling points were selected with three different methods. The L2 values, i.e the Euclidian norm or a non-normalized rmsd, of the difference between the reconstructed and the linearly sampled spectrum were calculated for 100 different Unix seed numbers, and ordered according to decreasing L2 values. Top trace: plain random sampling Middle Trace: Poisson-Gap sampling without λ variation. Bottom trace: Poisson-gap sampling with a sinusoidal variation of λ (θ = [0,π]) The latter procedure clearly has the lowest L2 values and is nearly independent of the seed number.

