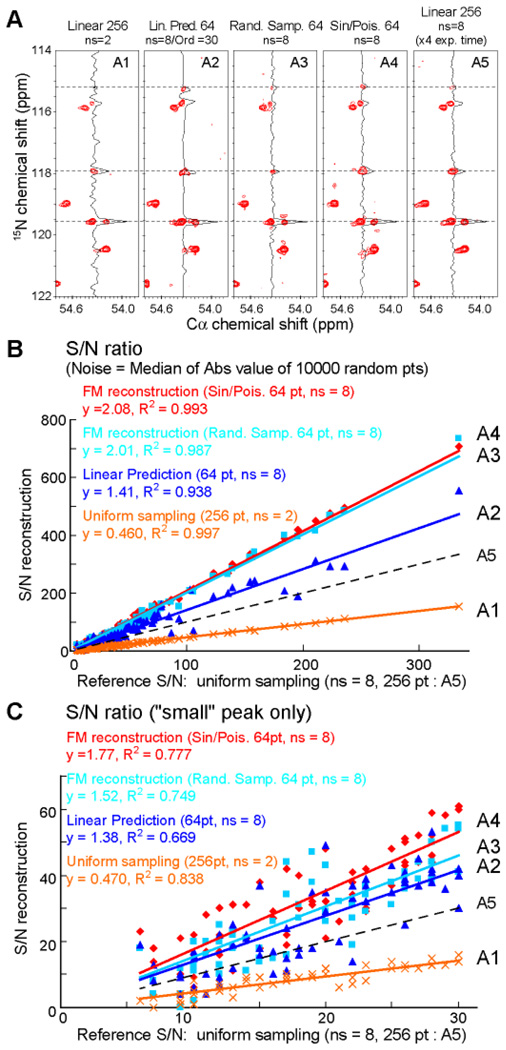
Figure 2.
Comparison of non-uniform sampling schedules with uniform acquisition and linear prediction. (A) A representative strip from the CαN spectrum5 of alternately 13C labeled protein GB1. The four strips at the left represent experiments of the same total measuring time (512 total scans). Strip 5 was recorded with 8 scans and 256 linear increments requiring a four-times longer experiment. For panel A2, the first 64 linear increments were extended with linear prediction using order parameter of 30. Panels 3 and 4 were obtained with a random sampling (64pts) and sine-weighted Poisson gap sampling (64 pts), respectively. B and C are plots of the S/N of all (B) and small (C) peaks, respectively. The S/N values of the picked peaks obtained with the procedures A1–A4 are plotted against A5.

