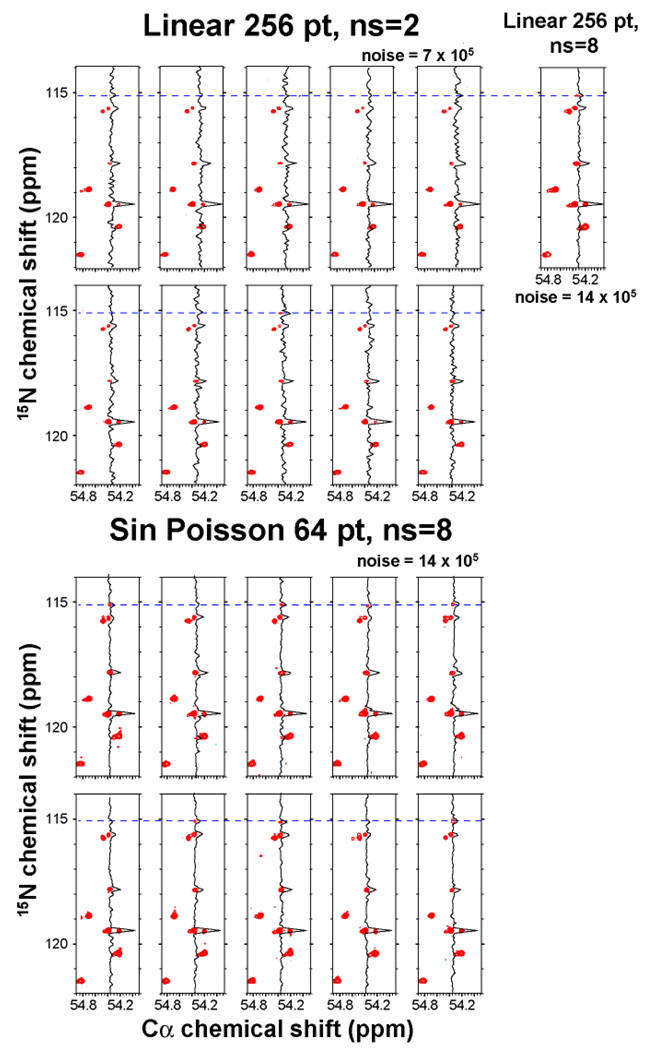
Figure 3.
Reliability of small peak detection. Top: The same NCa spectrum was recorded ten times linearly with 256 increments and two scans per increment. The same strip is shown as in Fig. 2 of the main manuscript. Bottom: The same NCa spectrum was recorded ten times with NUS recording 64 increments and eight scans per increment. The measuring time was 22 min for each of the experiments. Top right: For comparison, the spectrum was also recorded linearly with 256 increments and 8 scans per increment (total measuring time 1.5 hrs). The weak peak at the 15N chemical shift of 115.1 ppm, which is clearly manifested in the long linear experiment (1.5 hrs) is also clearly seen in the NUS spectra recorded in ¼ of the time (22 min). On the other hand, it is barely visible in only a few of the short linear experiments of 22 min.

